
 Yes, I’m going as a bar graph. I’m an ex-physicist, a tech writer and a geek, so it’s perfect.
I have to admit that after 30 years of working on technical illustrations that ended up on magazine covers and people’s walls as art it’s a little bit of a come-down, but hey, this one is interactive.
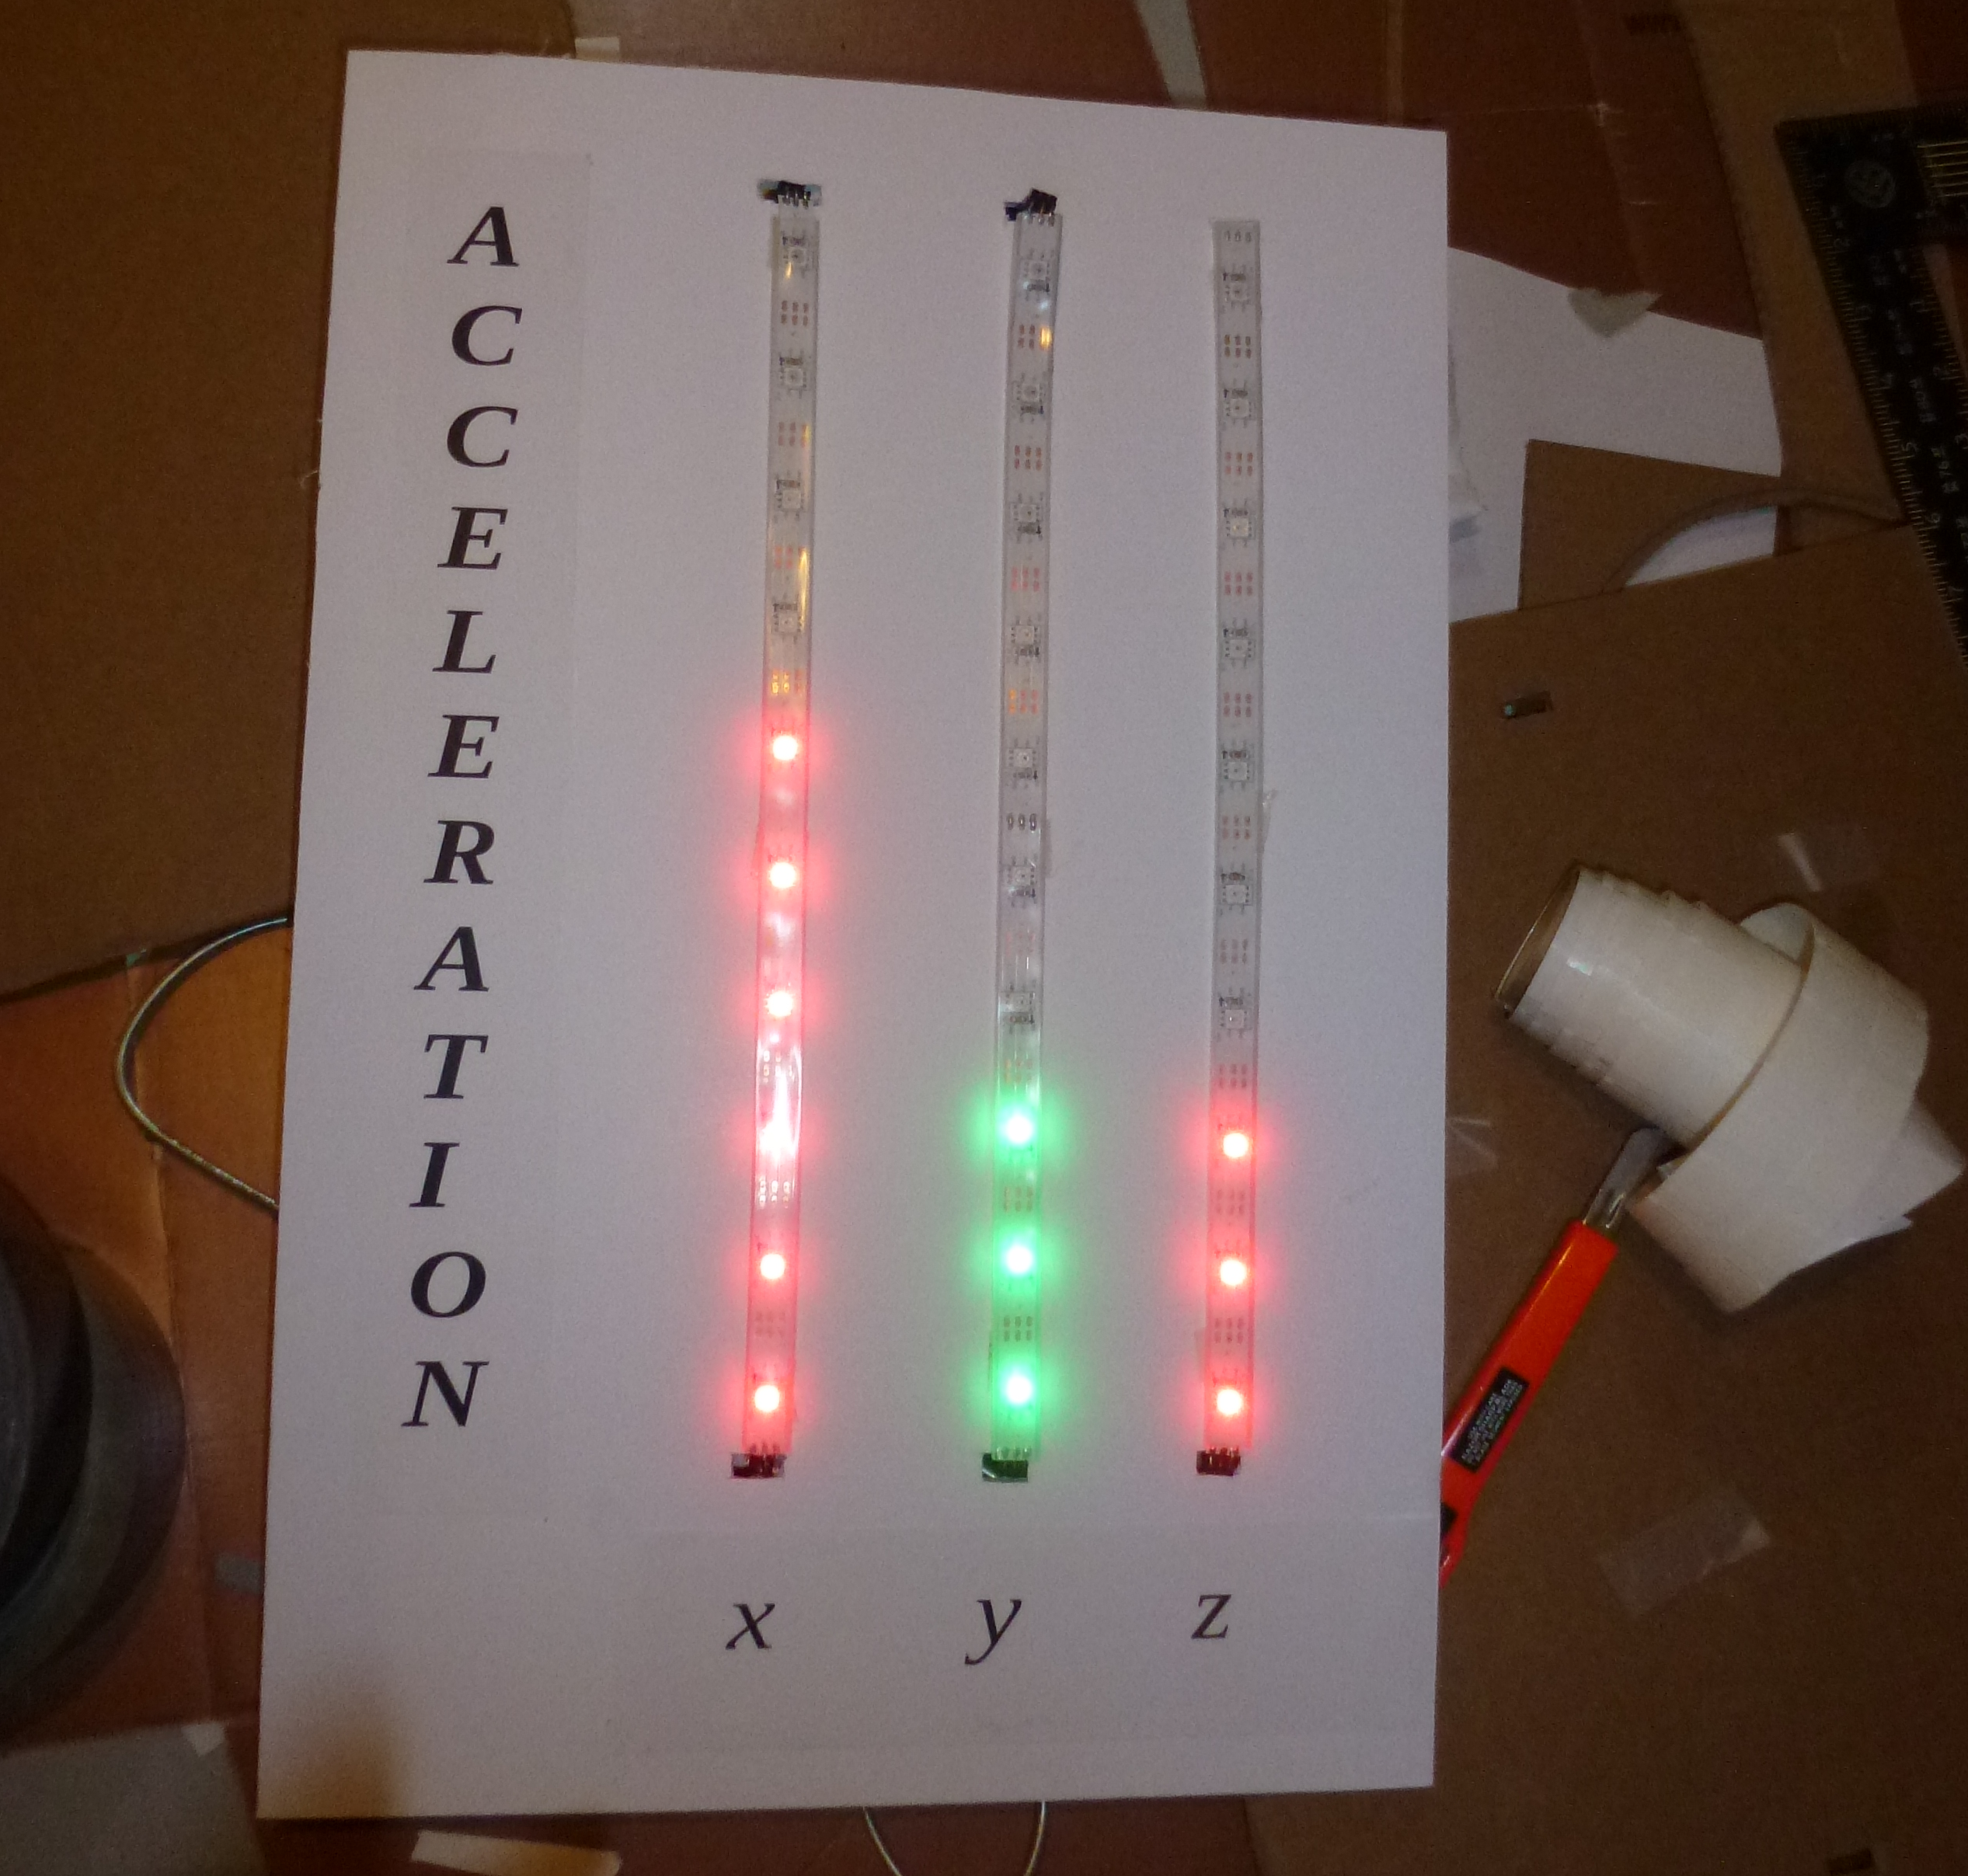
So that’s an Adafruit neopixel strip, sliced up into three sections, with little right-angle headers and jumpers wires connecting them behind the scenes. Also on the back of the foamcore: a 14-bit 3-axis accelerometer, a power distribution strip and an arduino clone sold by some folks down the road. (I like their boards particularly, because they put a bunch of 3-pin headers in the spare space, with Vcc, ground and signal all right next to each other. )
The code for all this is very simple, mostly lifted from various example files. I get the accelerations, divide them by a moving average of the past couple seconds, and then scale with a square root so that 10 LEDs can represent a reasonable dynamic range. Green is acceleration in the positive direction, red is negative. The library for reading the accelerometer is huge, so the whole thing clocks in at almost 10K — if I wanted to do this with a Tiny84, I’d have to roll my own.
Also , I’m stupidly proud of the display routines — the LED segments are connected in a sort of capital-N shape, so getting lights to go up and down on the y-axis segment requires logic that’s backwards from the other two segments. Simpler to connect, marginally harder to code.
Oh, and it’s all powered from a backup battery with a couple of USB plugs on it. Batteries with USB out have become so standard that it doesn’t make much sense to use anything else, even it it’s not really ideal as a power connector.
